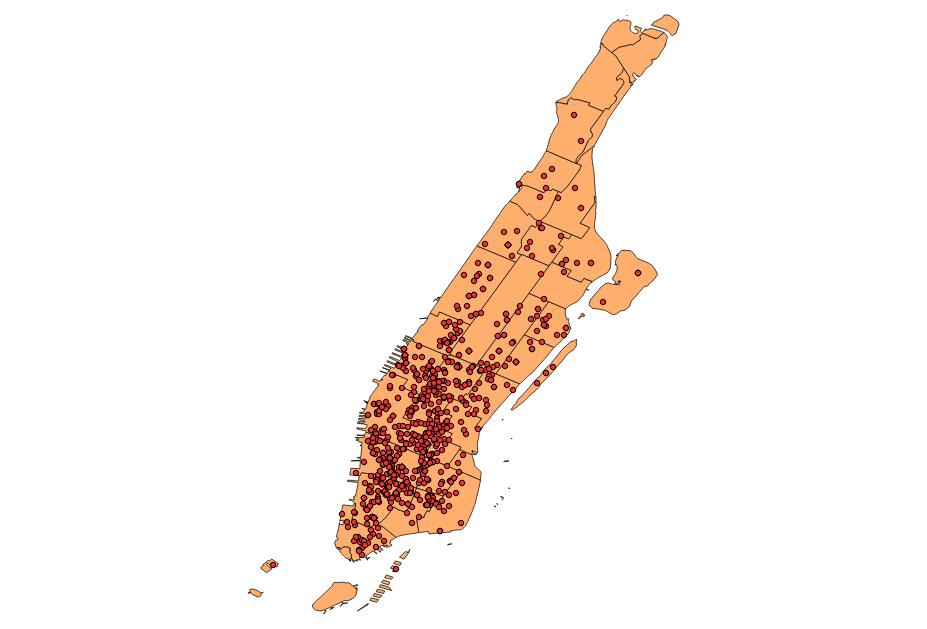
Map 1: A map of Manhattan showing the tweets in a dot that contains #Halloween hashtags on 10/30/2015 and 10/31/2015. The dataset was collected using a Twitter API, using Tweepy package in Python. As expected, the dots are disproportionately populated in the downtown - midtown area.
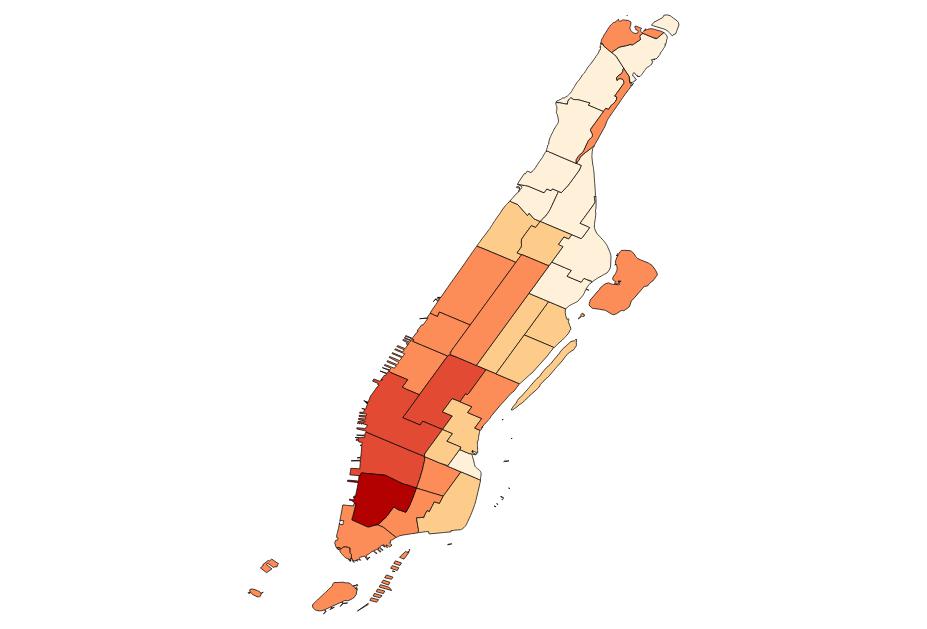
Maps 2: A choropleth of Manhattan showing the tweets that contains #Halloween hashtags. The Soho area, where the Halloween parade occurred, shows the highest number of tweets containing a #Halloween hashtag.
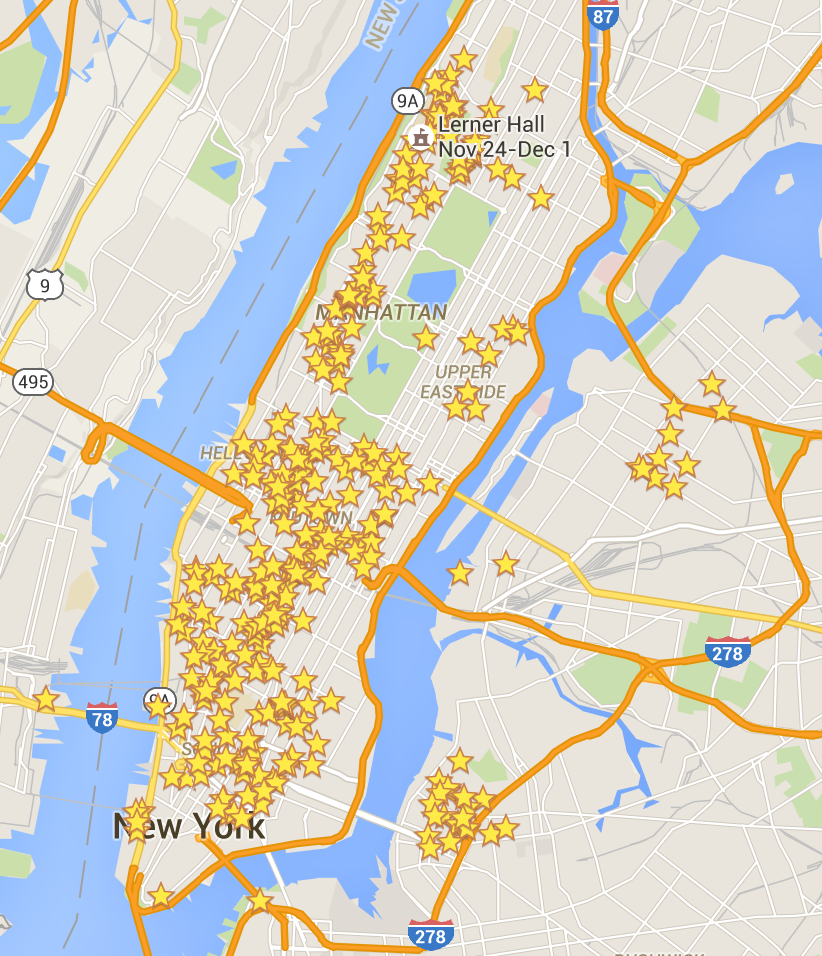
Map 3: I have a habit of starring every place I go on Google Maps. For those who may be unfamiliar with this feature, this basically keeps track of the places where I've been, ands saves those places. As I accumulate the stars, it makes me feel that I know the city better. The below is a screenshot of what I'm referring to.
Map 4: The below is a choropleth of Manhattan, showing the places I've been to. It can be seen that I've visited the most number of place in Midtown, Chelsea, and West Villeage, as well as places around Columbia, such as Morningside Heights, Upper West, and Central Harlem South. The Upper East Side, Lower East Side and Battery Parks are relatively my uncharted territories, which give me a good sense of where I should spend my time exploring.